A recent study of life expectancy reveals big differences. Christopher Murray of the Harvard School of Public Health analyzed mortality data by county, race, gender, and income. Murray found “eight Americas”:
Click “more” to continue
* Asian-Americans, average per capita income of $21,566, have a life expectancy of 84.9 years.
* Northland low-income rural whites, $17,758, 79 years.
* Middle America (mostly white), $24,640, 77.9 years.
* Low income whites in Appalachia, Mississippi Valley, $16,390, 75 years.
* Western American Indians, $10,029, 72.7 years.
* Black Middle America, $15,412, 72.9 years.
* Southern low-income rural blacks, $10,463, 71.2 years.
* High-risk urban blacks, $14,800, 71.1 years.
The study revealed significant differences by county.
The 25 highest counties by life expectancy:
County – Average Life Expectancy
Clear Creek, Colo. – 81.3
Eagle, Colo. – 81.3
Gilpin, Colo. – 81.3
Grand, Colo. – 81.3
Jackson, Colo. – 81.3
Park, Colo. – 81.3
Summit, Colo. – 81.3
Montgomery, Md. – 81.3
Lyon, Iowa – 81.3
Sioux, Iowa – 81.3
Nicollet, Minn. – 81.1
Story, Iowa – 81.0
Carver, Minn. – 81.0
Collier, Fla. – 81.0
Benton, Ore. – 80.9
Polk, Ore. – 80.9
Fairfax City, Va. – 80.9
Fairfax County, Va. – 80.9
La Paz, Ariz. – 80.9
Yuma, Ariz. – 80.9
Winneshiek, Iowa – 80.8
Morgan, Utah – 80.8
Summit, Utah – 80.8
Archuleta, Colo. – 80.8
Gunnison, Colo. – 80.8
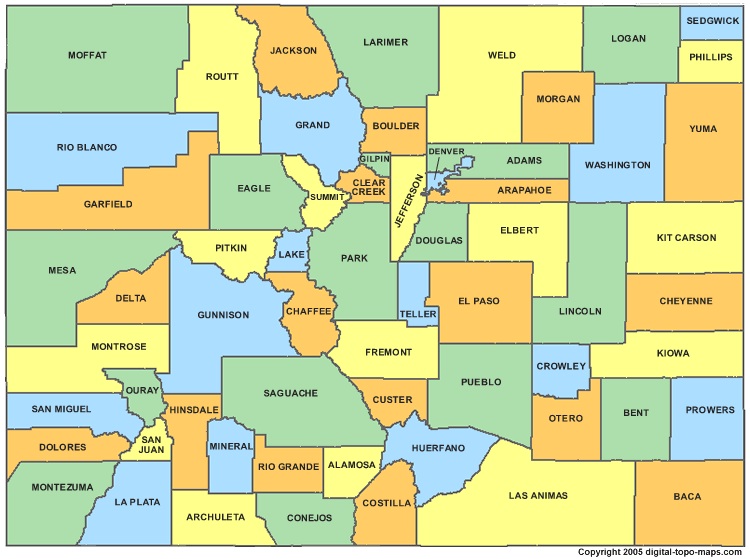
Over half the counties on the top 25 list are in the west, 9 of them in Colorado. Interesting. I grew up in Colorado and I always figured I would like to retire there. The whole state of Colorado ranks 12th. Hawaii is number 1. Mississippi ranks 50th.
The 25 lowest counties by life expectancy:
County – Average Life Expectancy
Washabaugh, S.D. 66.6
Todd, S.D. 66.6
Shannon, S.D. 66.6
Mellette, S.D. 66.6
Jackson, S.D. 66.6
Bennett, S.D. 66.6
Baltimore City, Md. 68.6
Petersburg, Va. 69.6
Marlboro, S.C. 69.6
Phillips, Ark. 69.8
Coahoma, Miss. 70.1
Union, Fla. 70.2
Baker, Fla. 70.2
Mcdowell, W.Va. 70.4
St. Louis City, Mo. 70.8
Pemiscot, Mo. 70.9
Sunflower, Miss. 71.1
Crittenden, Ark. 71.1
Richmond City, Va. 71.1
Washington, Miss. 71.1
Tunica, Miss. 71.2
Tallahatchie, Miss. 71.2
Quitman, Miss. 71.2
Logan, W.Va. 71.2
Martin, N.C. 71.2
It’s not just where you live of course. Life style is an important factor. So take good care of yourself! You can read more about this study at MSNBC and map your states average longevity here.

